
We can get the concept of deadlock in wikipedia.
The picture below gives a common scenario which leads to deadlock.
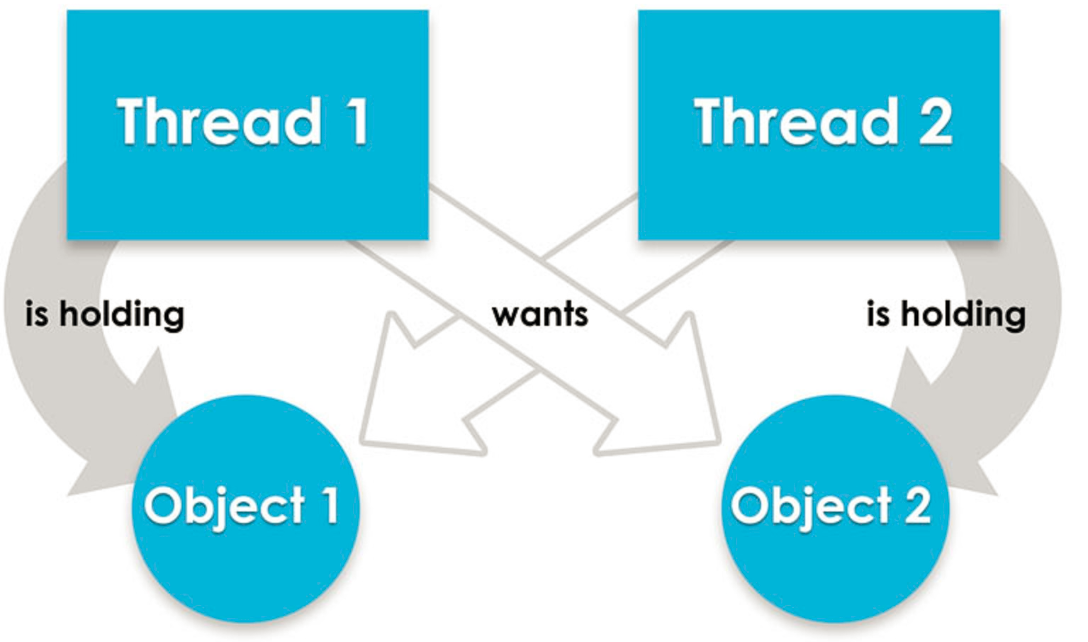
In this blog, I will share how to detect deadlock situation using JDK standard tool jstack. First we have to write a Java program which will lead to Deadlock:
package thread;
public class DeadLockExample {
/*
* Thread 1: locked resource 1
Thread 2: locked resource 2
*/
public static void main(String[] args) {
final String resource1 = "ABAP";
final String resource2 = "Java";
// t1 tries to lock resource1 then resource2
Thread t1 = new Thread() {
public void run() {
synchronized (resource1) {
System.out.println("Thread 1: locked resource 1");
try {
Thread.sleep(100);
} catch (Exception e) {
}
synchronized (resource2) {
System.out.println("Thread 1: locked resource 2");
}
}
}
};
Thread t2 = new Thread() {
public void run() {
synchronized (resource2) {
System.out.println("Thread 2: locked resource 2");
try {
Thread.sleep(100);
} catch (Exception e) {
}
synchronized (resource1) {
System.out.println("Thread 2: locked resource 1");
}
}
}
};
t1.start();
t2.start();
}
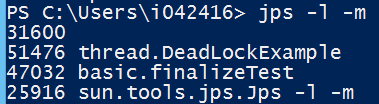
}Execute this program, you will get output: Thread 1: locked resource 1 Thread 2: locked resource 2 Then use command jps -l -m to list the process id of this deadlock program. In my example it is 51476:
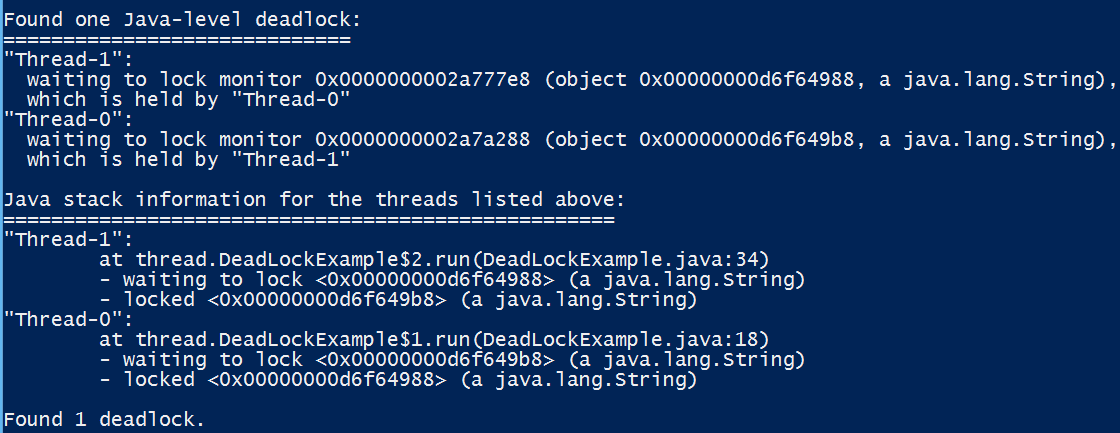
Just type jstack + process id, and it will display all detailed information about deadlock:
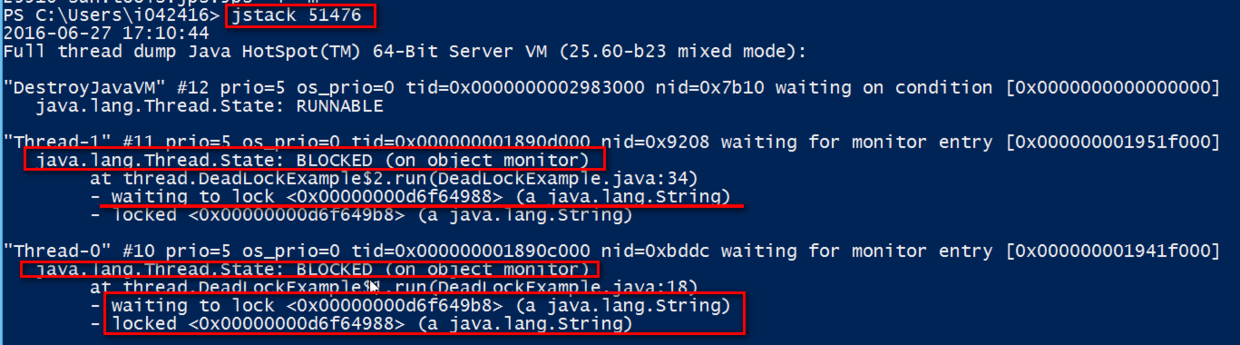
Here the object 0x00000000d6f64988 and 0x00000000d6f649b8represent the two resource String “ABAP” and “Java”.
Update on 2017-03-04 Saturday 10:35PM
how to get the thread state of a long-running application
Suppose you have found a long-running application which has high CPU utilization rate and you would like to know which exactly line is relevant. Use the following code to simulate the long running situation:
package thread;

import java.util.ArrayList;
import java.util.List;
import java.util.concurrent.ExecutorService;
import java.util.concurrent.Executors;


class MyThread implements Runnable{

    private List<Integer> myList;
    private Object host;
    public MyThread(List<Integer> list, Object object){
        this.myList = list;
        this.host = object;
    }

    public void updateListSafe(){
        synchronized(this.host){
            ArrayList<Integer> safe = new ArrayList<Integer>();
            safe.add(1);
        }
    }

    private void updateList(int i){
        synchronized(this.host){
            myList.add(i);
        }
    }

    @Override
    public void run() {
        while(true){
            updateList(1);
        }
    }

}
public class MyExecutor {

    private ArrayList<Integer> taskList = new ArrayList<Integer>();
    private Object object = new Object();
    private void launch(){

        ExecutorService executorService= Executors.newFixedThreadPool(10);

        executorService.execute(new MyThread(taskList, object));
        executorService.execute(new MyThread(taskList, object));
    }
    public static void main(String[] args) {
        MyExecutor test = new MyExecutor();
        test.launch();
    }
}
first find the process id of running application:

then use command jstack 23520 to get the stack trace:
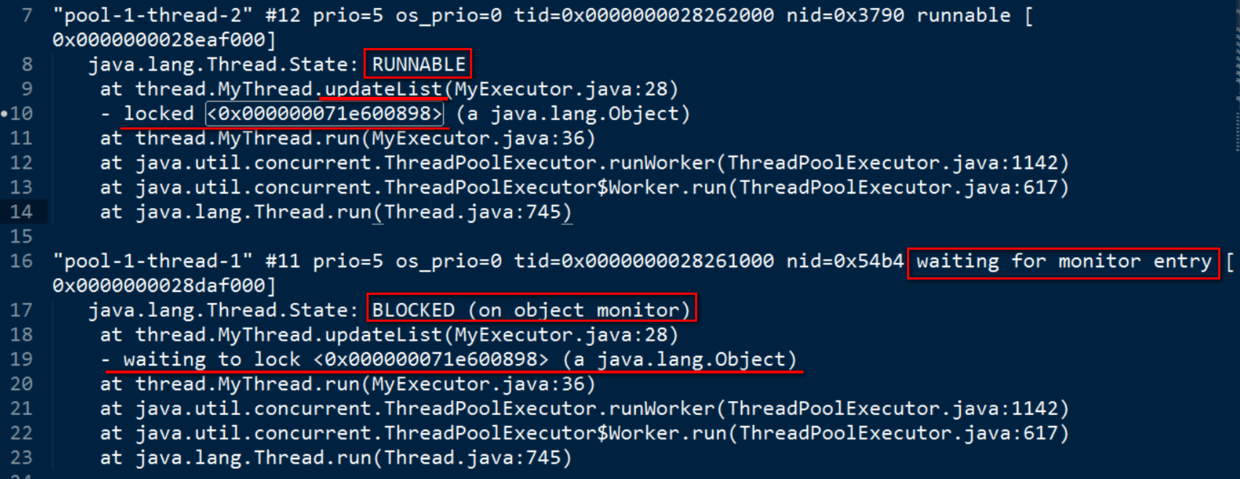
In line 9 and line 18 our application method MyThread.updateList is listed there.
要获取更多Jerry的原创文章,请关注公众号"汪子熙":


相关推荐
JStack和Java Thread Dumps分析
Kubernetes应用java程序无法使用jmap,jstack的解决方案.docx
主要介绍了通过jstack分析解决进程死锁问题实例代码,具有一定借鉴价值,需要的朋友可以参考下
主要介绍了Java线程Dump分析工具jstack解析及使用场景,具有一定借鉴价值,需要的朋友可以参考下
主要介绍了JVM---jstack分析Java线程CPU占用,线程死锁的解决,具有很好的参考价值,希望对大家有所帮助。一起跟随小编过来看看吧
使用jstack定位分析CPU消耗问题
作用:JConsole是一个监视和管理Java应用程序的工具,可以监视JVM的运行状态、查看内存和CPU使用情况等。 优势:JConsole易于使用,可以通过图形化界面查看JVM的运行状态,快速了解应用程序的性能状况。 局限:...
通过ps到java进程号将进程的jstack信息输出。jstack信息是java进程的线程堆栈信息,通过该信息可以分析java的线程阻塞等问题。
抓取jstack方法及解决system用户执行jstack命令权限问题, 打开cmd窗口,输入命令 jstack -l 49824>>C:/error01.txt 其中49824为tomcat8.0 的pid ; error01.txt 这个可以自己取名字 多输出几份jstack 文件,做比对...
死锁,Deadlock(重点关注) 2.执行中,Runnable(重点关注) 3.等待资源,Waiting on condition(重点关注) 4.等待监控器检查资源,Waiting on monitor 5.暂停,Suspended 6.对象等待中,Object.wait() ...
windows系统jstack自动抓取脚本
java应用运行过程中难免会出现问题,特别是在生产环境,发生异常或宕机情况,需要诊断与分析,定位原因,进行优化,避免下次再次出现问题。 虽然现在有很多可视化工具,使用起来比命令行更方便,但我们仍需要对基本...
图形界面分析threadump_jstack分析工具_包含jdk。IBM出品,用来分析jstack pid 打印的信息。用着挺方便的。
需要本地安装JDK并配置JAVA环境变量。 之后使用java -jar jca469.jar即可打开工具。 直接将dump出来的堆栈信息,打开,便可分析。
分析java线程日志的工具,使用jstack把java线程日志dump下来,然后上传到该工具,就可以查看线程阻塞情况等信息。
java程序性能分析thread dump和heap dump,dump文件:在故障定位(尤其是out of memory)和性能分析的时候,dump...thread dump:记录java应用中各线程在某一时刻的运行的位置,即执行到哪一个类的哪一个方法哪一个行上。
这是一个 jstack 保存的死锁现场,由于 log4j consoleAppender 和 System.out 竞争资源导致的锁冲突,目前还不知道根本原因,需要分析。
(1)如果堆栈信息明确是应用代码,则证明该线程正在等待资源,一般是大量读取某种资源且该资源采用了资源锁的情况下,线程进入等待状态,等待资源的读取,或者正在等待其他线程的执行等。 (2)如果发现有大量的...
MPP的jstack分析结果
通过jps 和jstack定时收集java进程的线程信息